King County Metro continues to see steady ridership growth in its long road to recovery from pandemic losses. Nonetheless, Metro remains one of the slowest-to-recover transit agencies in the nation. Across its system, Metro’s average weekday ridership in the spring of 2024 was about 64% of 2019 levels.
Meanwhile, nine U.S. metros have exceeded their pre-pandemic ridership levels, and 76 metros saw a bigger transit resurgence than Seattle, according to a data analysis by the American Public Transportation Association (APTA).
Metro’s ridership recovery has been uneven. Routes in Southeast Seattle and South King County lost fewer riders during the pandemic and have been quicker to regain them. In contrast, North Seattle and East King County ridership saw large drops and has lagged more in recovering.
Ridership also has not recovered uniformly across times of the day and week. Weekend ridership has been a bit quicker to recover, buoyed by the post-pandemic trend of trips being less oriented around peak-hour commutes.
South Seattle buses like Route 7, Route 60, and the recently RapidRide-ified H Line (formerly Route 120) have nearly fully recovered their ridership. Route 50 has actually surpassed its 2019 ridership, boosted by increased service.
It’s a different story for routes within North Seattle, the western shores, and the central core of the city — parts of the city popular with white collar workers, who largely switched to teleworking during the pandemic and who have not regained transit-riding habits as quickly. Among top ridership buses, some of the biggest losers include Route 5, Route 3, Route 65, and Route 70. Formerly steady workhorse buses like the C Line, D Line, Route 40, Route 44, Route 2, Route 3, and Route 8 are still missing between 30% and 40% of their pre-pandemic ridership.
Metro has cut service levels on these routes, potentially creating a negative feedback loop with ridership.
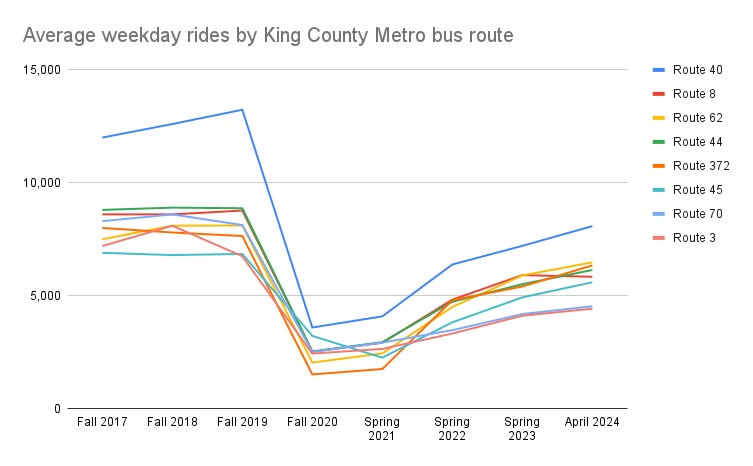
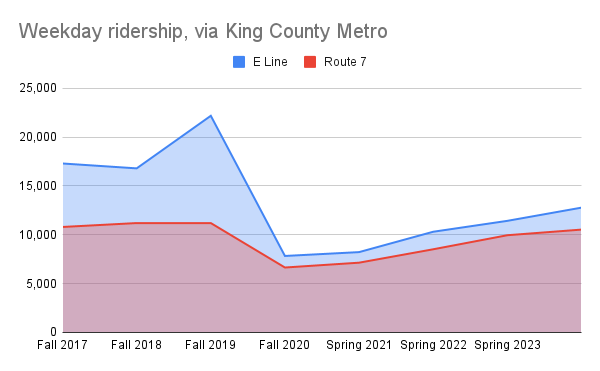
The southward shift in Metro’s service profile and ridership density has meant that Route 7 is now Metro’s second highest ridership bus, leapfrogging the Route 40 and the D Line in the pandemic era and maintaining that lead.
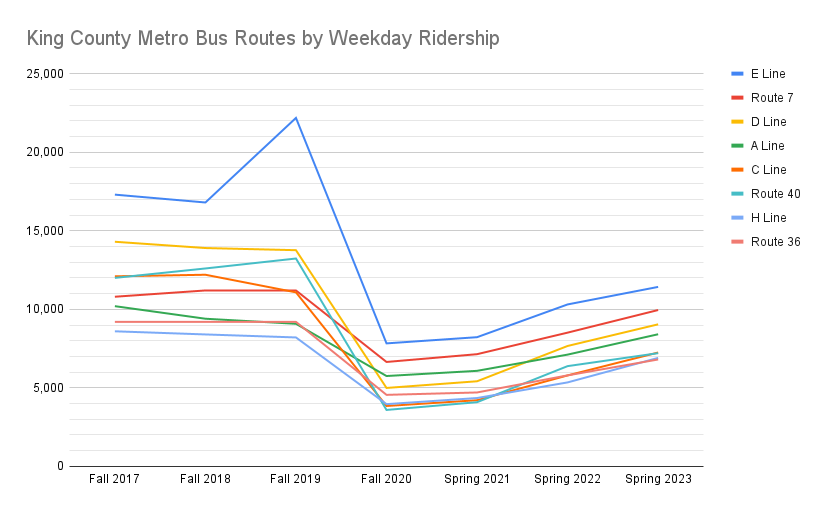
The E Line remains the highest ridership bus in the region, and its average weekday rides climbed to 12,779 in April and May of 2024, according to Metro. However, it still sits at 68% of its three-year pre-pandemic weekday ridership average. Due in part to construction impacts during the Alaskan Way Viaduct replacement project and a big boost in bus frequency to compensate, the E Line hit a record-high of 22,184 weekday rides in fall 2019.
Why ridership recovery matters
Some transit experts have suggested that comparing to pre-pandemic ridership levels is misleading and distracting, since transit systems should be designed for the demand and reality we face today. There’s a kernel of wisdom in this argument, since unrealistic goals tend to be unhelpful, but it also flirts with complacency and losing sight of long-term goals around climate and reducing car dependency.
It's time to stop comparing US public transit ridership to 2019, because that world is gone and not coming back. Transit agencies in the US are rebalancing to grow their new markets, which are all-day, all-direction trips of many purposes, but of course this takes time. https://t.co/kepCPUgBaE
— Jarrett Walker (@humantransit) August 6, 2024
Outside of the U.S., transit agencies have generally been quicker to recover ridership. The rise of telecommuting may mean a chunk of work commutes have vaporized for good, as Portland-based transit consultant and author Jarrett Walker argued. However, that doesn’t mean transit is doomed to lower ridership if agencies succeed in making their services useful for other trips, from errands to social outings to entertainment. It may take time to establish these new service patterns, but that doesn’t mean agencies should dawdle.
Seeking culprits for ridership losses
So, what is to blame for Metro’s slow ridership recovery? For those looking to minimize deeper issues, it would be easier to blame lower service frequencies and leave it at that. Lower frequencies are certainly a drag on ridership; however, some routes have seen service levels hold steady without ridership fully rebounding.
| Route | Fall 2017 | Fall 2018 | Fall 2019 | Fall 2020 | Spring 2021 | Spring 2022 | Spring 2023 | April 2024 | % of pre-pandemic |
|---|---|---|---|---|---|---|---|---|---|
| E Line | 17,300 | 16,800 | 22,184 | 7,831 | 8,225 | 10,310 | 11,426 | 12,779 | 68.11% |
| Route 7 | 10,800 | 11,200 | 11,200 | 6,648 | 7,143 | 8,515 | 9,954 | 10,531 | 95.16% |
| D Line | 14,300 | 13,900 | 13,763 | 4,994 | 5,419 | 7,666 | 9,044 | 9,321 | 66.64% |
| A Line | 10,200 | 9,400 | 9,078 | 5,753 | 6,083 | 7,116 | 8,412 | 9,463 | 98.99% |
| C Line | 12,100 | 12,200 | 11,079 | 3,846 | 4,212 | 5,791 | 7,250 | 7,342 | 62.26% |
| Route 40 | 12,000 | 12,600 | 13,233 | 3,594 | 4,087 | 6,383 | 7,208 | 8,082 | 64.09% |
| H Line | 8,600 | 8,400 | 8,209 | 3,963 | 4,352 | 5,347 | 6,907 | 7,842 | 93.32% |
| Route 36 | 9,200 | 9,200 | 9,201 | 4,554 | 4,706 | 5,795 | 6,806 | 6,924 | 75.26% |
| Route 8 | 8,600 | 8,600 | 8,772 | 2,529 | 2,917 | 4,828 | 5,912 | 5,840 | 67.46% |
| Route 62 | 7,500 | 8,100 | 8,110 | 2,042 | 2,448 | 4,503 | 5,899 | 6,478 | 81.97% |
| Route 44 | 8,800 | 8,900 | 8,873 | 2,532 | 2,947 | 4,733 | 5,513 | 6,140 | 69.32% |
| Route 372 | 8,000 | 7,800 | 7,643 | 1,517 | 1,757 | 4,805 | 5,410 | 6,342 | 81.16% |
| Route 60 | 5,400 | 5,700 | 5,557 | 2,663 | 2,970 | 4,412 | 5,176 | 5,421 | 97.63% |
| Route 160 | 3,106 | 3,068 | 3,867 | 5,058 | 5,353 | N/A | |||
| Route 45 | 6,900 | 6,800 | 6,850 | 3,222 | 2,259 | 3,824 | 4,928 | 5,597 | 81.71% |
| F Line | 5,600 | 5,700 | 5,291 | 3,222 | 3,337 | 4,098 | 4,748 | 4,984 | 90.12% |
| Route 106 | 5,600 | 5,800 | 5,583 | 2,661 | 2,931 | 3,798 | 4,566 | 5,020 | 88.68% |
| Route 70 | 8,300 | 8,600 | 8,130 | 2,515 | 2,925 | 3,476 | 4,189 | 4,536 | 54.37% |
| B Line | 6,200 | 6,200 | 6,079 | 2,011 | 2,206 | 3,305 | 4,177 | 4,726 | 76.72% |
| Route 3 | 7,200 | 8,100 | 6,749 | 2,440 | 2,646 | 3,328 | 4,116 | 4,427 | 60.23% |
Five main theories explaining the drop in ridership jump out:
- Work-from-home and flexible office hour trends have sapped Metro of its staple of work commute riders.
- Bus reliability has dropped. Some routes have seen significant issues with congestion delays, causing riders to abandon them.
- Lower transit frequencies have pushed riders to other modes of transport.
- A rise in safety incidents and perceptions of disorder on buses has discouraged people from choosing to ride.
- Lingering perceptions of discomfort and health risk in crowded spaces have made some riders inclined to choose other options.
Likely, it’s a combination of these factors that explains why one-third of Metro’s pre-pandemic ridership has disappeared. But the relevant importance of each factor in explaining the loss could help the agency determine where to focus its resources and attention as it seeks to build back its ridership base as quickly as feasible.
Already, the agency has focused new investment on transit security, more that doubling its force of security officers. Whether caused by that deployment or not, Metro report security incidents on buses and stops are trending downward. Even with a positive trend, it may still take time to win back riders who dropped off due to experiences or perceptions of disorder or violence on the buses.
Efforts to improve bus reliability and frequency have been more muted, which is unfortunate since ample evidence that those factors weigh heavily in driving ridership gains. Commute Seattle conducted a broad survey published in early 2023 that found that riders reported that transit being fast, frequent, and reliable is the biggest thing impacting their decision to ride.
“People are overwhelmingly focused on cost, convenience, and time. That’s what they care about; it’s reliable, frequent, affordable, reliable transit,” Commute Seattle communications director Noah An said last year. “And while safety is an important part of the conversation, it’s not really the primary factor that’s driving people’s decision making.”
Hopes of increasing bus frequency any time soon have been dashed by Metro’s labor shortage, which has cut into its ranks of bus operators and mechanics. The agency’s workforce contracted during the pandemic as it cut service hours and operator retirements spiked, but staffing up again has been challenging due to the shortage of bus drivers impacting agencies nationwide. The agency is increasing training class sizes and ramping up recruitment efforts, but not anticipating being able to return to pre-pandemic service levels in the short-term.
Even if recruitment did rebound, Metro will need additional funding allocated to hit and exceed pre-pandemic service levels. Due to lower ridership, fare revenue is down, whereas inflation is driving operating costs up. While the King County Council had been considering a countywide transit funding measure before the pandemic hit, councilmembers have not yet reintroduced such a proposal. Newly elected county councilmembers Teresa Mosqueda and Jorge Baron did support such an idea in their campaigns, however, suggesting growing support for the idea on council — to along with strong indication King County voters would approve such a measure.
Transit speed improvement require collaboration with the local transportation department with jurisdiction over the street. While Seattle has added some dedicated bus lanes here and there, their extent is not nearly broad enough to guarantee reliability and ample transit speed systemwide, let alone on the routes getting spot improvements.
Case in point is Route 8, which continues to earn the moniker the “L8” for its legendary lateness and unreliability, especially during peak hours. Despite a concerted advocacy campaign by riders, the Seattle Department of Transportation continues to slow walk street changes of significance to speed up the bus. Instead, SDOT has focused on studying the idea of moving the route off of congested Denny Way, which would take quite some time to come to fruition, if it even gets off the drawing board.
In the meantime, Route 8 ridership has suffered, actually dropping slightly from spring 2023 to spring 2024, which Metro attributed to a construction reroute. Notwithstanding, most routes grew ridership significantly in that timespan. With about 5,800 daily riders, Route 8 is still missing a third of its pre-pandemic ridership, despite a high amount of housing growth in the corridor. A lack of reliability is clearing hurting ridership.
Electrification supersedes ridership goals
While a measure to fund bus service has been on the backburner, the County has been very focused on electrifying its fleet. This raises an interesting question of whether such a goal will interfere with the goal of restoring ridership.
Safety, Equity, and Sustainability are the three official core goals that Executive Dow Constantine has laid out for King County Metro. Absent from the list are service quality or ridership growth. That said, the sustainability goal does recognize that transit ridership reduces emissions: “Transit is one of the greenest forms of transportation in our region. Metro takes the equivalent of 190,000 cars off the road every day and has an annual net reduction of 600,000 metric tons of carbon per year. Public transportation reduces pollution locally and combats the climate crisis globally.”
Rather than focus on ridership growth as the means to build on that climate win, Constantine has stressed electrifying the fleet. He has pledged to do so by 2035, even if that means lesser ridership growth and relying on unproven battery bus technology to achieve this goal.
Since Metro takes 190,000 cars off the road every day with the ridership it has achieved, it would be fair to ask if the bigger climate impact is in increasing ridership period — not whether all riders are sitting in electric buses rather than hybrids by 2035 or 2040.